
· Alexander · Grafana
IPMI Monitoring via Telegraf
Monitor IPMI sensor data with Telegraf and visualize it in Grafana.
Monitor IPMI sensor data with Telegraf and visualize it in Grafana.

Learn how to automate Docker container builds using Jenkins.
A look at the current status and upcoming projects.
Update on the migration of the site to a new platform and recent downtime.
A Prometheus exporter for Pi-Hole gives you a much more detailed Grafana dashboard than the old InfluxDB script.
Use the nvidia-smi Telegraf plugin to pull GPU stats into Grafana.
Monitor Hyper-V performance counters with Telegraf and visualize them in Grafana.
A 72 hour saga of chasing down packet loss through Caddy, EdgeRouter firmware, and a mis-provisioned Comcast channel.
Getting Deluge stats into InfluxDB and Grafana using a thin client and a community InfluxDB script.
Update on a recent HDD failure.

Automating a custom Caddy Docker image build so you can use the Cloudflare DNS plugin for wildcard Let's Encrypt certs.
Use NAT rewrite rules on your EdgeRouter to force devices with hard coded DNS servers through Pi-Hole.
Feed Speedtest results into InfluxDB and graph download/upload speed over time in Grafana.
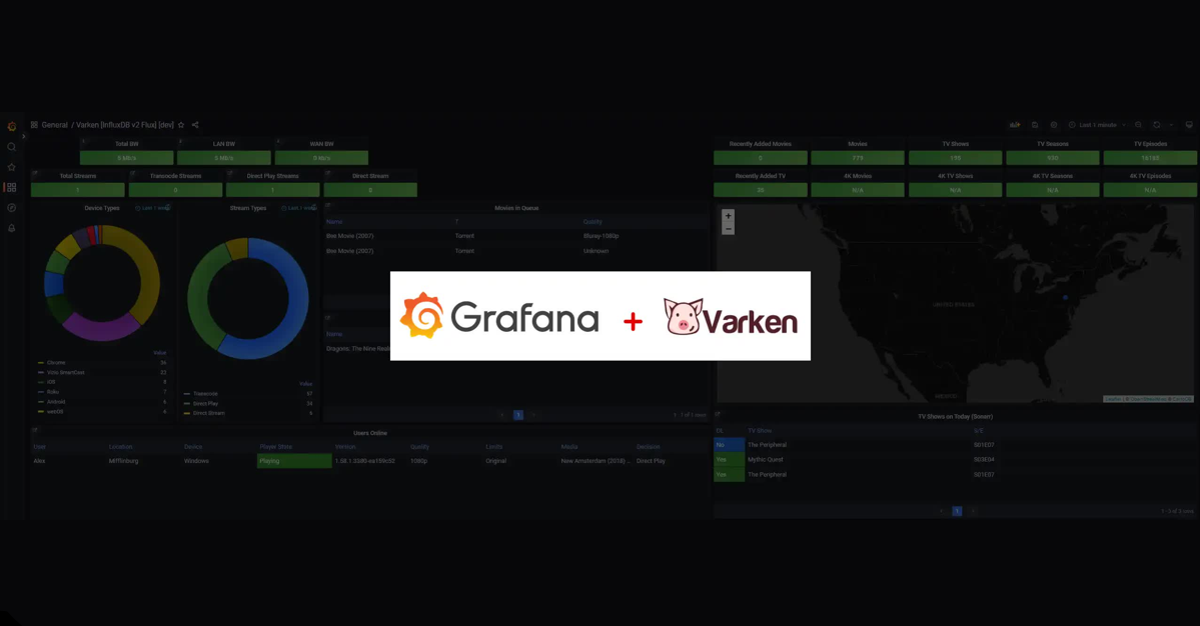
Deploy Varken to send Plex, Sonarr, Radarr, and Tautulli stats to InfluxDB and build a Grafana dashboard.
Export Transmission stats to Prometheus and graph them in Grafana.