· Alexander · Grafana · 5 min read
Monitoring your Plex Media Server with Varken
Deploy Varken to send Plex, Sonarr, Radarr, and Tautulli stats to InfluxDB and build a Grafana dashboard.
Before we get started, you should go buy the guys over at Varken a coffee and star their repo. Varken makes the data collection of Plex server stats via companion apps stupid easy.
For this to work you will need at least one of the following services configured and running:
Sonarr, Radarr, Lidarr, Tautulli, Ombi
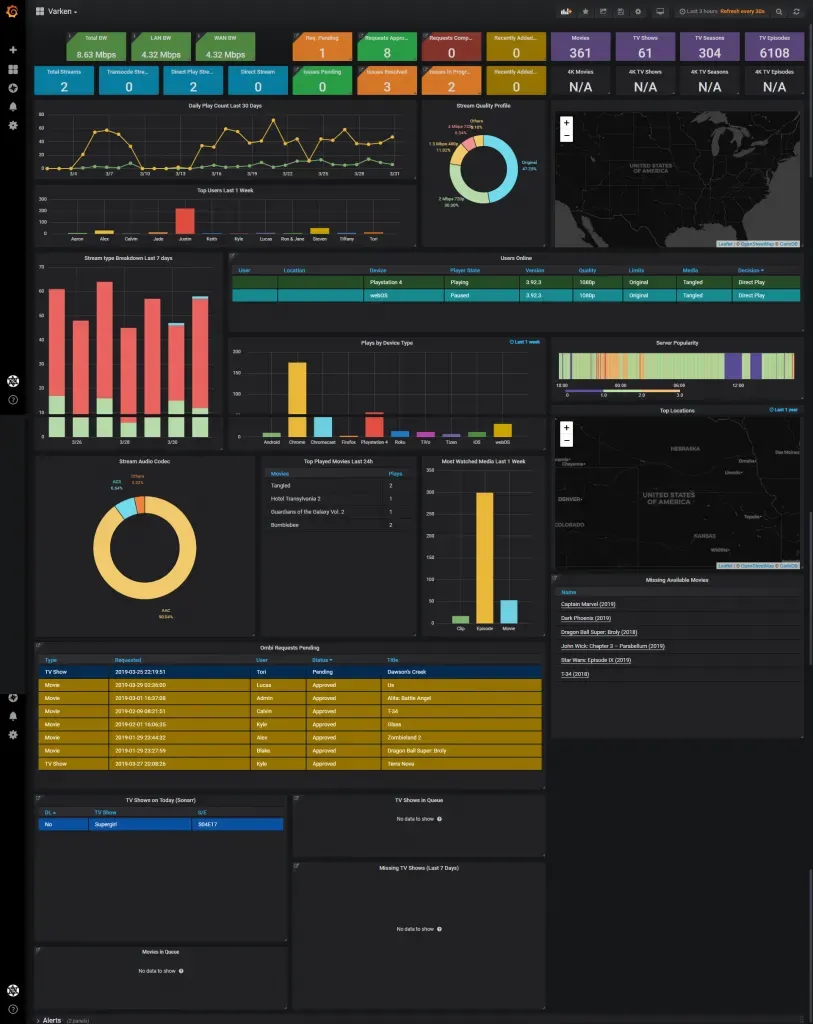
If you followed my guide, here, then deploying Varken into your InfluxDB Docker network setup should be rather easy. First SSH to your docker host. Then create the config directory and copy down my compose file for Varken.
mkdir /opt/containers/varken && curl https://gist.githubusercontent.com/alexandzors/39760b9e742d6b9b28a0164af8648ac8/raw/091f7b35ad2e44fdaa46f7c410d97e2292f9905c/varken-compose.yml -o /opt/containers/varken/varken-compose.yml
Now we need to edit the compose file and enter the required info for our services. (You can mount a pre-defined config file to Varken if you do not want to use environment variables! Also the official Varken compose file can be found here, which includes Grafana and InfluxDB.)
nano /opt/containers/varken/varken-compose.ymlChange the volumes section to match your setup. Then edit the following entries under the “environment” section:
| Variable | Value |
|---|---|
| TZ | your Timezone |
| VRKN_GLOBAL_MAXMIND_LICENSE_KEY | MaxMind key for GEOIP DB |
| VRKN_INFLUXDB_URL | influx |
| VRKN_INFLUXDB_USERNAME | varken |
| VRKN_INFLUXDB_PASSWORD | ’password’ |
| VRKN_TAUTULLI_1_URL | url for your Tautulli install |
| VRKN_TAUTULLI_1_APIKEY | Tautulli API key |
| VRKN_SONARR_1_URL | url for your Sonarr install |
| VRKN_SONARR_1_APIKEY | Sonarr API key |
| VRKN_RADARR_1_URL | url for your Radarr install |
| VRKN_RADARR_1_APIKEY | Radarr API key |
| VRKN_OMBI_1_URL | url for your Ombi install |
| VRKN_OMBI_1_APIKEY | Ombi API key |
Save and close the file CTRL+X then Y. Once the file is closed we can go ahead and create the varken database / varken user in Influx. (-u root
curl -XPOST http://localhost:8086/query -u root:password --data-urlencode "q=CREATE DATABASE varken"
Create the user for Varken using the password you specified in the config earlier. Then assign user permissions.
curl -XPOST http://localhost:8086/query -u root:password --data-urlencode "q=CREATE USER varken WITH PASSWORD 'password'"curl -XPOST http://localhost:8086/query -u root:password --data-urlencode "q=GRANT WRITE ON varken TO varken"curl -XPOST http://localhost:8086/query -u root:password --data-urlencode "q=GRANT READ ON varken TO grafana"
Deploy Varken:
docker-compose -f /opt/containers/varken/varken-compose.yml up -dImporting the Varken dashboard
First we need to set up the data source for Varken. Navigate to Grafana, log in, and then go to your data sources configuration page. Click Add data source and then click InfluxDB. Input the following:
- Name: InfluxDB [Varken]
- URL: http://influxdb_influx_1
- Database: varken
- User: grafana
- Password: ‘grafana user password’
The Grafana user info was defined if you followed my guide, however if you did not you can substitute these credentials with the varken user instead.
Click Save & Test. Then click + > Import. In the Grafana.com Dashboard, import ID 9585.
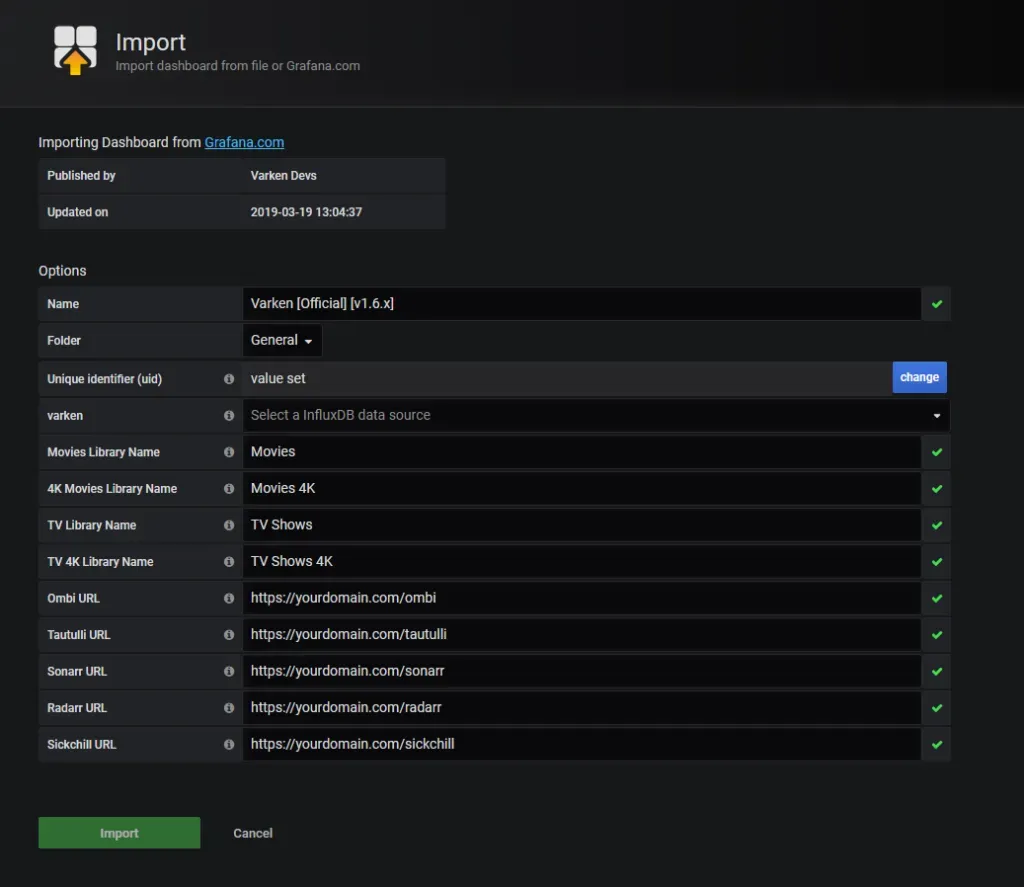
Fill out the info to match your setup and make sure you select varken in the varken dropdown box. Once done, click Import.
Optional
Here are a few panel JSONs for extra panels you can add to your Varken dashboard.
{ "aliasColors": { "": "#b7dbab", "AAC": "#f2c96d", "AC3": "#70dbed", "DCA": "#f2c96d", "OPUS": "#f29191" }, "breakPoint": "50%", "cacheTimeout": null, "combine": { "label": "Other", "threshold": ".04" }, "datasource": "InfluxDB [Varken]", "decimals": 0, "fontSize": "110%", "format": "none", "gridPos": { "h": 8, "w": 4, "x": 12, "y": 4 }, "hideTimeOverride": true, "id": 59, "interval": null, "legend": { "percentage": true, "percentageDecimals": 0, "show": true, "sort": "total", "sortDesc": true, "values": false }, "legendType": "On graph", "links": [], "maxDataPoints": 3, "nullPointMode": "connected", "options": {}, "pieType": "donut", "pluginVersion": "6.5.2", "strokeWidth": "1", "targets": [ { "alias": "$tag_stream_audio_codec", "groupBy": [ { "params": [ "stream_audio_codec" ], "type": "tag" } ], "measurement": "Tautulli", "orderByTime": "ASC", "policy": "default", "refId": "A", "resultFormat": "time_series", "select": [ [ { "params": [ "hash" ], "type": "field" }, { "params": [], "type": "distinct" }, { "params": [], "type": "count" } ] ], "tags": [ { "key": "server", "operator": "=", "value": "1" }, { "condition": "AND", "key": "type", "operator": "=", "value": "Session" } ] } ], "timeFrom": "2w", "timeShift": null, "title": "Stream Audio Codec", "type": "grafana-piechart-panel", "valueName": "total"}{ "aliasColors": { "0.7 Mbps 328p": "#9ac48a", "1.5 Mbps 480p": "#f2c96d", "2 Mbps 720p": "#b7dbab", "3 Mbps 720p": "#f2c96d", "4 Mbps 720p": "#f29191", "Original": "#70dbed" }, "breakPoint": "50%", "cacheTimeout": null, "combine": { "label": "Other", "threshold": ".04" }, "datasource": "InfluxDB [Varken]", "decimals": 0, "fontSize": "110%", "format": "none", "gridPos": { "h": 8, "w": 4, "x": 8, "y": 4 }, "hideTimeOverride": true, "id": 69, "interval": null, "legend": { "percentage": true, "percentageDecimals": 0, "show": true, "sort": "total", "sortDesc": true, "values": false }, "legendType": "On graph", "links": [], "maxDataPoints": 3, "nullPointMode": "connected", "options": {}, "pieType": "donut", "pluginVersion": "6.5.2", "strokeWidth": "1", "targets": [ { "alias": "$tag_quality_profile", "groupBy": [ { "params": [ "quality_profile" ], "type": "tag" } ], "measurement": "Tautulli", "orderByTime": "ASC", "policy": "default", "refId": "A", "resultFormat": "time_series", "select": [ [ { "params": [ "hash" ], "type": "field" }, { "params": [], "type": "distinct" }, { "params": [], "type": "count" } ] ], "tags": [ { "key": "server", "operator": "=", "value": "1" }, { "condition": "AND", "key": "type", "operator": "=", "value": "Session" } ] } ], "timeFrom": "2w", "title": "Stream Quality Profile", "type": "grafana-piechart-panel", "valueName": "total"}