· Alexander · Grafana · 1 min read
Expanding Pi-Hole Stats with Prometheus
A Prometheus exporter for Pi-Hole gives you a much more detailed Grafana dashboard than the old InfluxDB script.

The other day I came across a Prometheus Exporter for Pi-hole (found in a comment on /r/pihole) that gives WAY more stats/data compared to the InfluxDB script I posted about a while back. With this exporter, I was able to set up a more detailed dashboard.
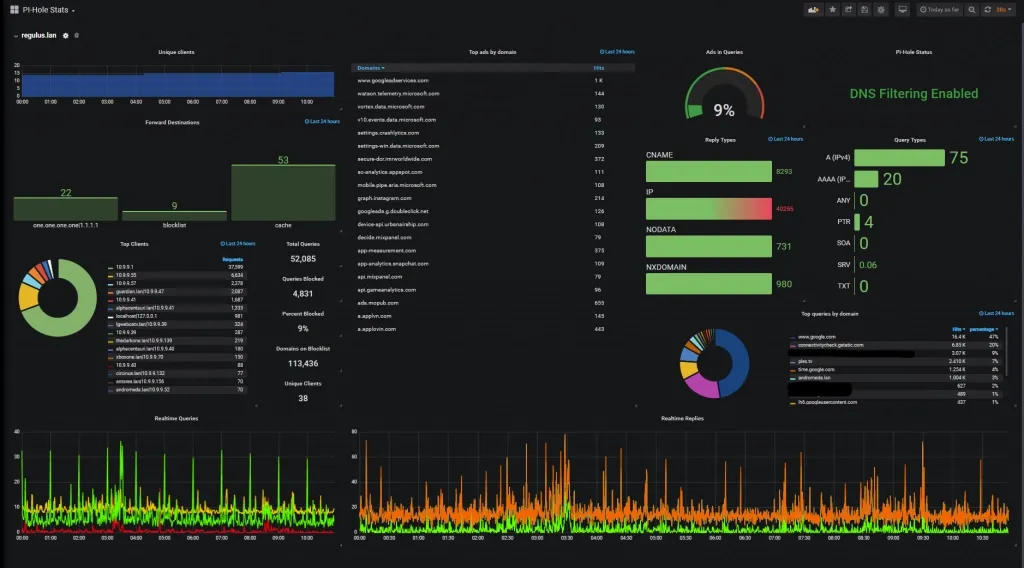
Now currently I only have this setup for a single instance of Pi-Hole. I am currently in the process of setting up a second instance as a backup when my primary one goes down for updates. This dashboard can be easily updated to have either a clone of this info for your second instance or a drop down selector for instances. You’ll have to update your queries to support dashboard variables, which isn’t very hard to do.
The dashboard JSON can be found here.