· Alexander · Grafana · 9 min read
Monitoring Your Plex Media Server with Varken [Dev]
Using Varken to monitor your Plex Media Server and related services with Grafana and InfluxDB
Have you ever wanted to easily monitor your backend apps that service your media server? Well if you are already running InfluxDB and Grafana then do I have a cool utility for you! Varken is a utility app that lets you gather data from your backend media server applications and send this data to InfluxDB. You can then take this data and visualize it via Grafana. If you have followed my Grafana guide series then getting this setup will be a breeze. If not make sure you already have InfluxDB and Grafana setup and communicating! You will also need one or more of the following applications installed, configured, and running to gather data from.
Varken also supports these apps + some in the dev branch, but I currently do not use them so will not be covering them in this post.
- Ombi
- Lidarr
- Overseerr [dev branch]
- SickChill
- Unifi Controller (I use this but monitor it via another service)
In my case I have Sonarr, Radarr, and Tautulli running with Plex as the media server. So this post will be focusing on that.
Creating the Directory Structure and Building Varken
This install will require some familiarity with git commands. If you are unfamiliar I will do my best to make this as easiest to follow as possible. Mainly we will be pulling the Varken repository locally and then building a custom docker image based off PR#242 (from ǝuoqɹǝuuᴉp of all people :) ) which adds InfluxDB v2 support. To get started, ssh to your docker host and create a new directory structure for Varken.
ssh user@hostmkdir /opt/docker/varkenNext create a new .git sub folder inside the new varken directory. This will house the clone of Varken’s git repository.
mkdir /opt/docker/varken/.gitChange directory to .git and clone the Varken repository.
cd /opt/docker/varken/.gitgit clone https://github.com/Boerderij/Varken.gitOnce this is done it should create a new sub folder called “Varken”. Change directory to this new folder and run the following commands thanks @timbo on stack overflow to check out the PR with v2.0 support.
cd Varkengit fetch origin pull/242/head:varken-influxdb2git checkout varken-influxdb2Running these commands will first fetch the changes in PR #242 and then create a local branch called “varken-influxdb2”. We can then check out this new branch to use the changes from the PR to build our custom container image.
docker build -t yourname/varken:influxdb2-devThis will take a few minutes to complete depending on your system specs. Once it is done you should see an output like the image below.
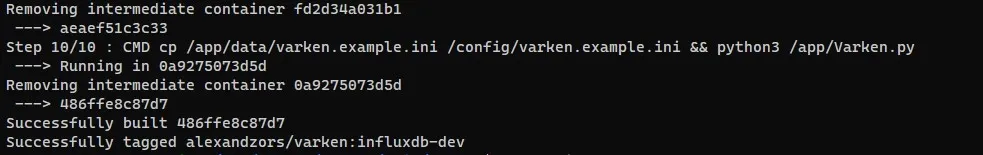 Docker container build output
Once the build process is complete we can check to make sure it was added to Docker’s local image store.
docker image ls | grep yourname/varken:influxdb2-dev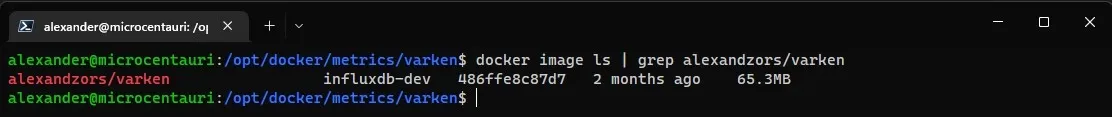 Docker image list showing the built container
Setting up the Docker Compose file
Now that we have our container image ready we can quickly create our docker-compose.yml file for Varken. Make sure you are in the main /opt/docker/varken/ directory.
cd /opt/docker/varkenThen create the new docker compose file with the following information. Make sure to change yourname to the name you used above for the image.
nano docker-compose.yml# Varken [Custom] docker-compose.yml
version: '3'services: varken: restart: unless-stopped image: yourname/varken:influxdb2-dev networks: db: volumes: - /opt/docker/metrics/varken:/config
networks: db: external: name: influxdb-netYou can then save and close the file by hitting CTRL + X then y.
Configuring Varken
Varken uses an initialization file (.ini) to house its configuration, which we need to persistently mount to our Varken container. Change directory to the main Varken dir and then clone the example file from GitHub.
cd /opt/docker/varkenwget https://raw.githubusercontent.com/Boerderij/Varken/develop/data/varken.example.ini .Next copy and rename the example file into varken.ini for Varken to use.
cp varken.example.ini varken.iniBefore we can edit the configuration file we need to obtain a Maxmind DB key. This is pretty straight forward and will require you to make an account.
Obtaining a Maxmind DB API key
First we need to sign up for a Maxmind account, which you can do here (It’s free!). Follow the sign-up process and make sure to verify the account. Once completed, login to your new account. After login, you will be greeted with the following page.
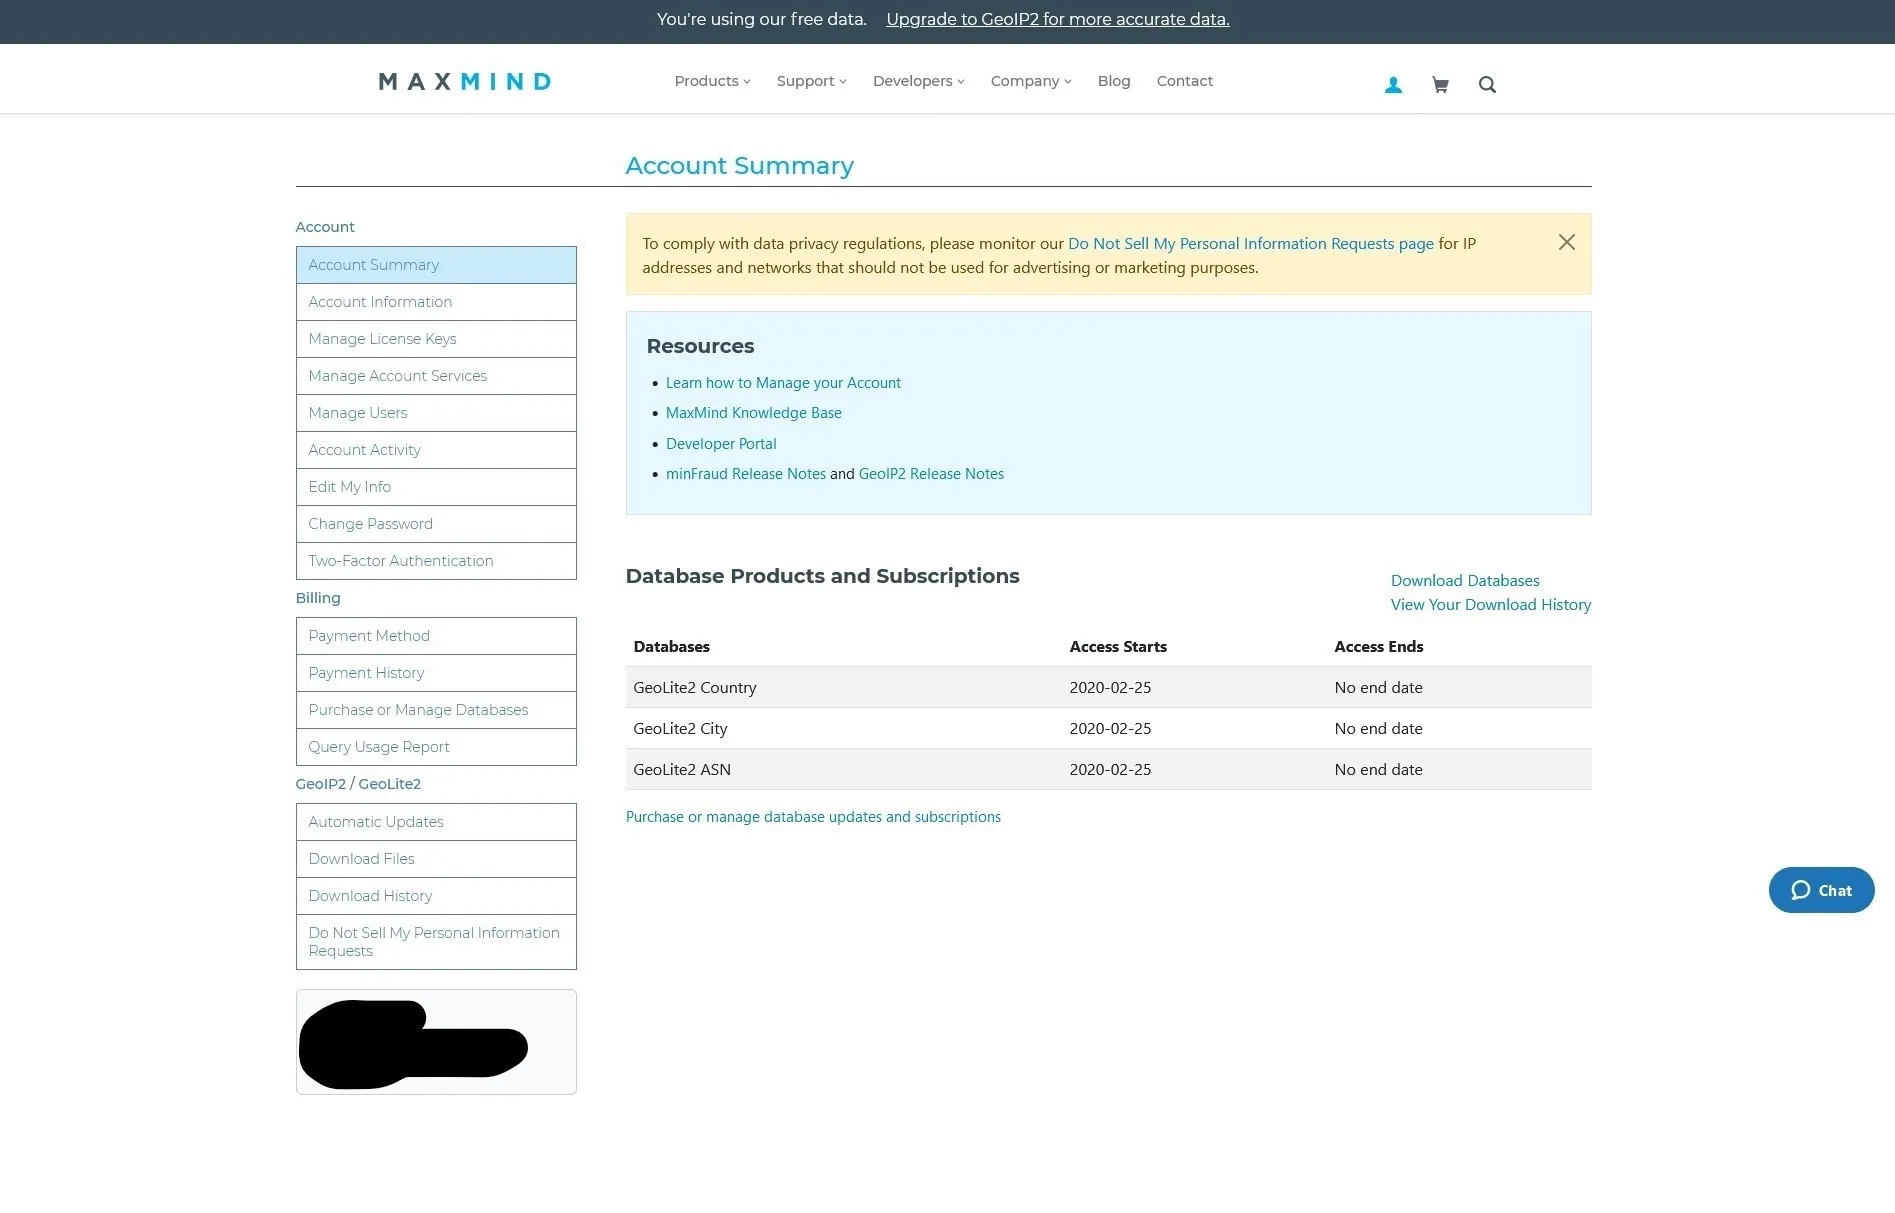 Maxmind account summary page
Click on the “Manage License Keys” option on the left side. Then click on “Generate new license key” when the page loads.
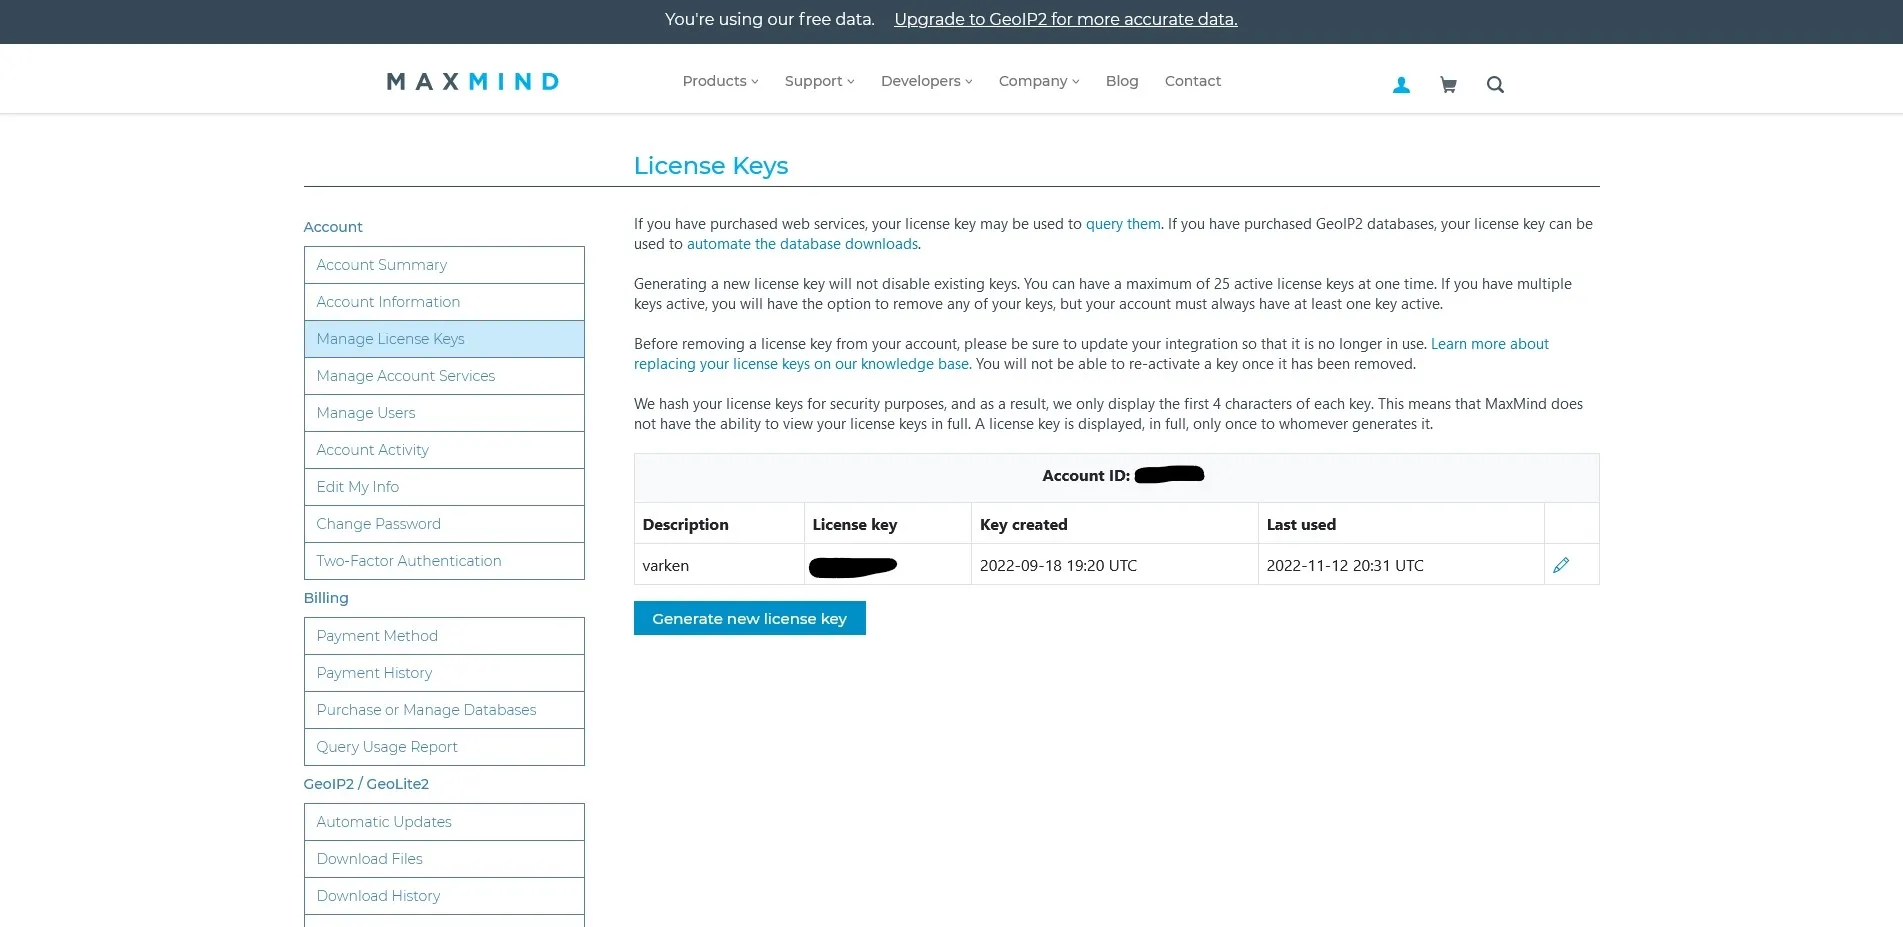 Maxmind license key management page
Add “varken” to the description label field and select “no” for the question in the box. Then click “confirm”.
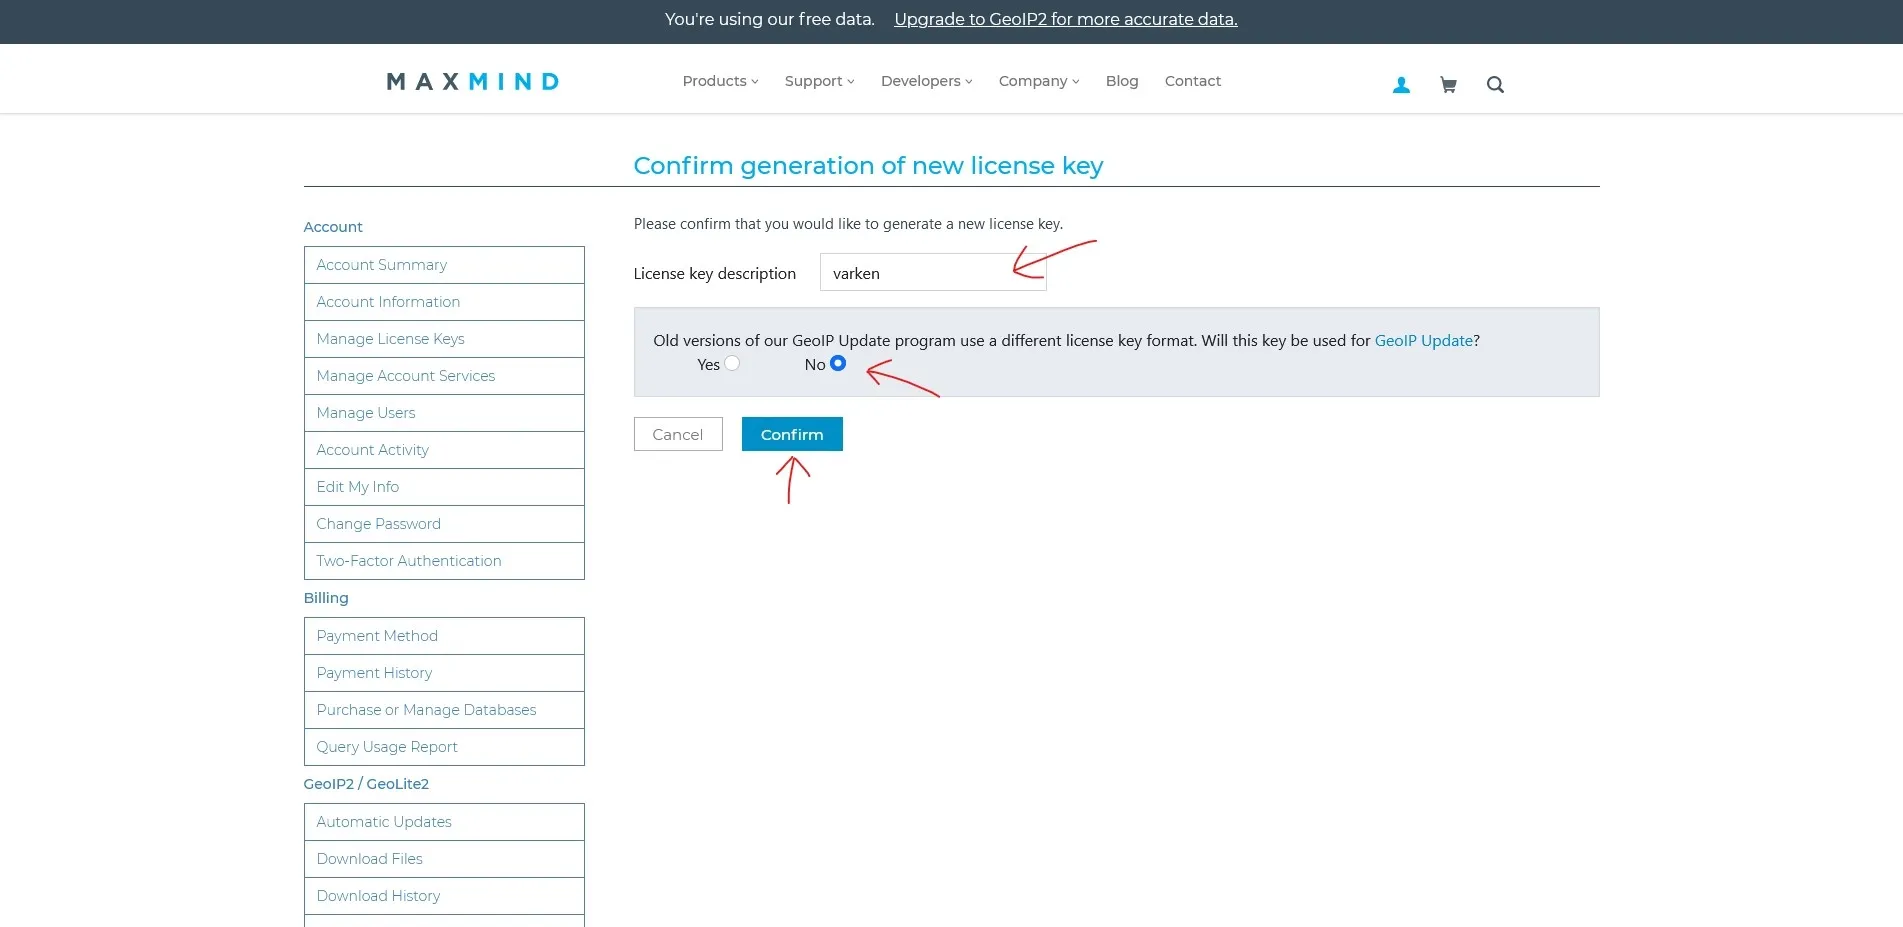 Generating a new Maxmind license key
At this point you will be shown your Maxmind key. Copy this key somewhere safe as if you lose it you will need to regenerate a new key.
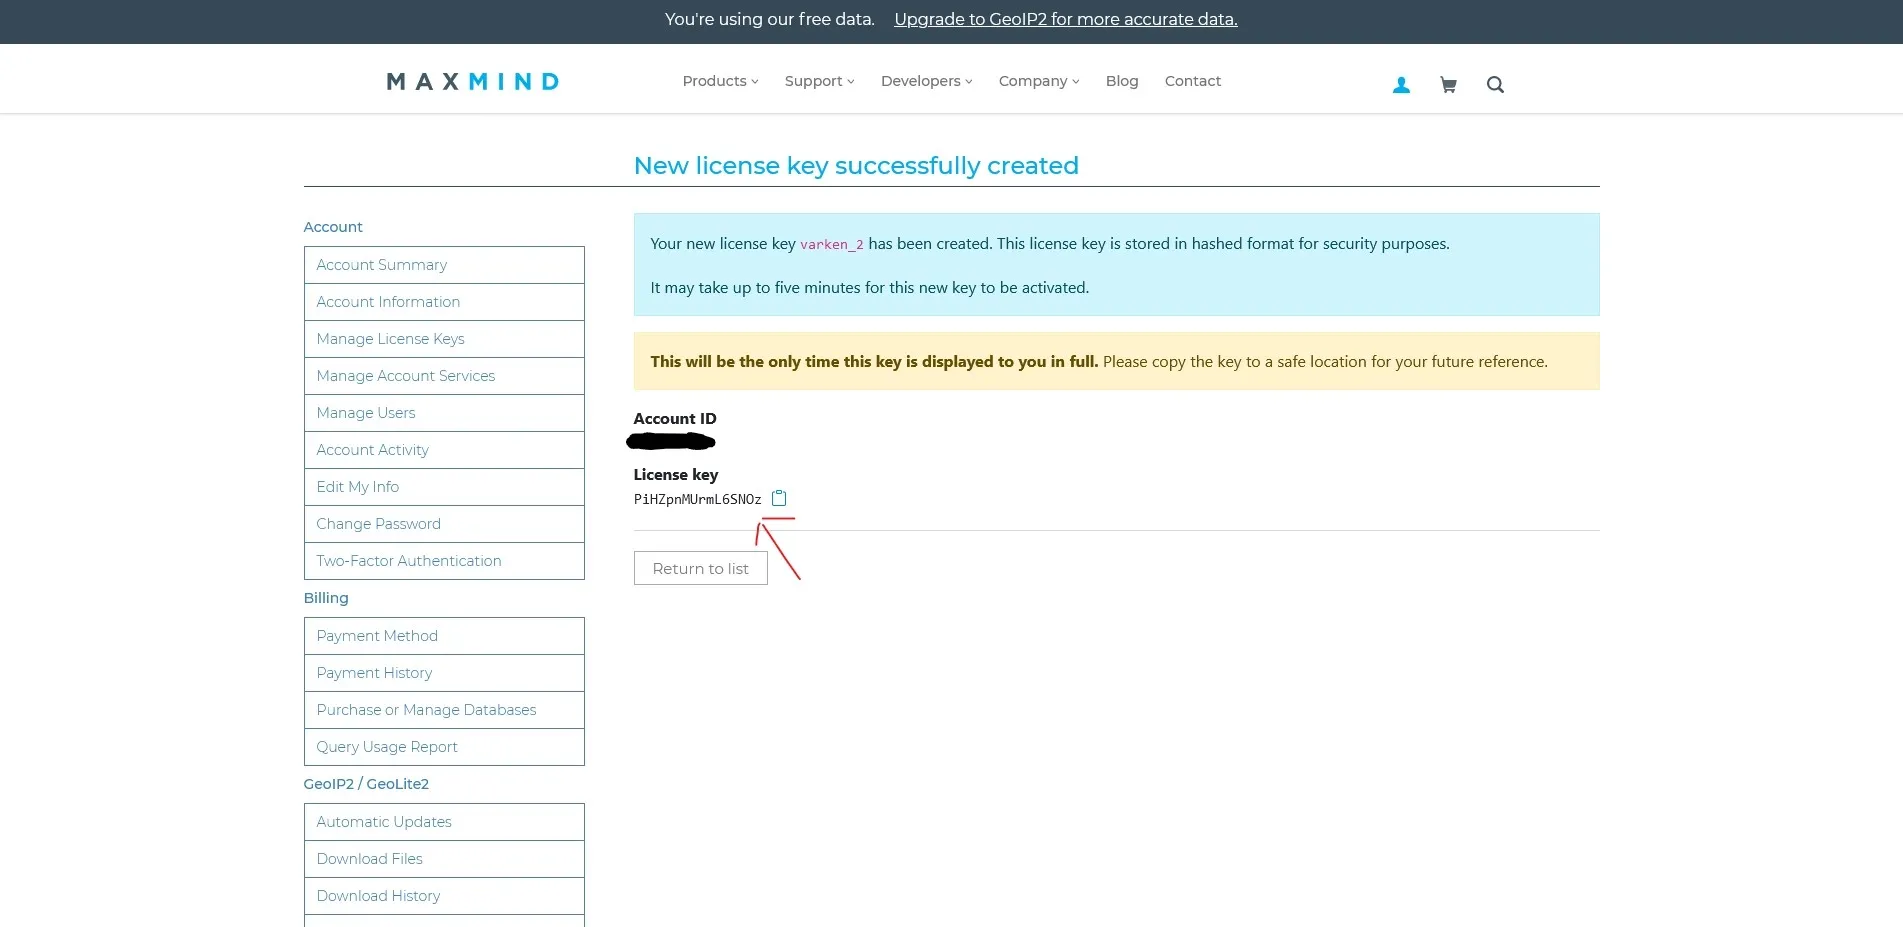 New Maxmind license key
varken.ini
With our Maxmind key in hand, we can now edit the varken.ini file. Switch back over to your terminal session and edit the varken.ini file.
nano varken.iniThere is a lot in here, so we are going to go section by section. The first section is the global options. This is where we configure Varken specific settings. Varken supports multiple servers for each of the supported services. To do this you can add “,2” etc. to the IDs. Then duplicate the config sections and append the appropriate number to the section title ([sonarr-2] etc.). We can also disable the services we are not using by appending false instead of a number. For demonstration purposes I am assuming you only have one instance of Sonarr, Radarr, and Tautulli set up. Edit the global section to match your environment and add the Maxmind license key we obtained earlier to the maxmind_license_key = option.
[global]sonarr_server_ids = 1radarr_server_ids = 1lidarr_server_ids = falsetautulli_server_ids = 1ombi_server_ids = falsesickchill_server_ids = falseunifi_server_ids = falsemaxmind_license_key = <insert your maxmind license key here>overseerr_server_ids = falseScroll down with the arrow keys and edit the InfluxDB section. If you followed my guide for Grafana then the settings below will match it. If not you will need to obtain your influxdb settings and your admin username and password.
[influxdb]url = influxdbport = 8086ssl = falseverify_ssl = falseusername = influxdbadminuserpassword = influxdbadminpassorg = labNext is the config for Tautulli. For this we will need our API key. Login to Tautulli and then go to Settings > Web Interface and scroll to the bottom. Un-hide the API key and copy it. In the [tautulli-1] section edit the URL to match your environment. Then add your API key to the apikey option.
[tautulli-1]url = url.for/tautullifallback_ip = 1.1.1.1apikey = <api key>ssl = trueverify_ssl = falseget_activity = trueget_activity_run_seconds = 30get_stats = trueget_stats_run_seconds = 3600Next section is for Sonarr. We will need Sonarr’s API key which we can get by logging into Sonarr and going to Settings > General and then copy the API Key. Edit the url option to match your environment. Then edit the apikey option with your API key from Sonarr.
[sonarr-1]url = url.for/sonarrapikey = <api key>ssl = trueverify_ssl = falsemissing_days = 7missing_days_run_seconds = 300future_days = 1future_days_run_seconds = 300queue = truequeue_run_seconds = 300Lastly we can edit the Radarr section. It will be the same process as Sonarr’s but with Radarr’s information.
[radarr-1]url = url.for/radarrapikey = <api key>ssl = trueverify_ssl = falsequeue = truequeue_run_seconds = 300get_missing = trueget_missing_run_seconds = 300Save and close the file by hitting CTRL + x then y.
Deploying Varken
Now that we have the configuration file configured it’s time to deploy Varken. To do this run the following command in the /opt/docker/varken directory.
docker compose up -dTo verify it is running:
docker ps Docker process list showing Varken running
To view the logs to verify Varken is sending data:
docker logs -f varken-varken-1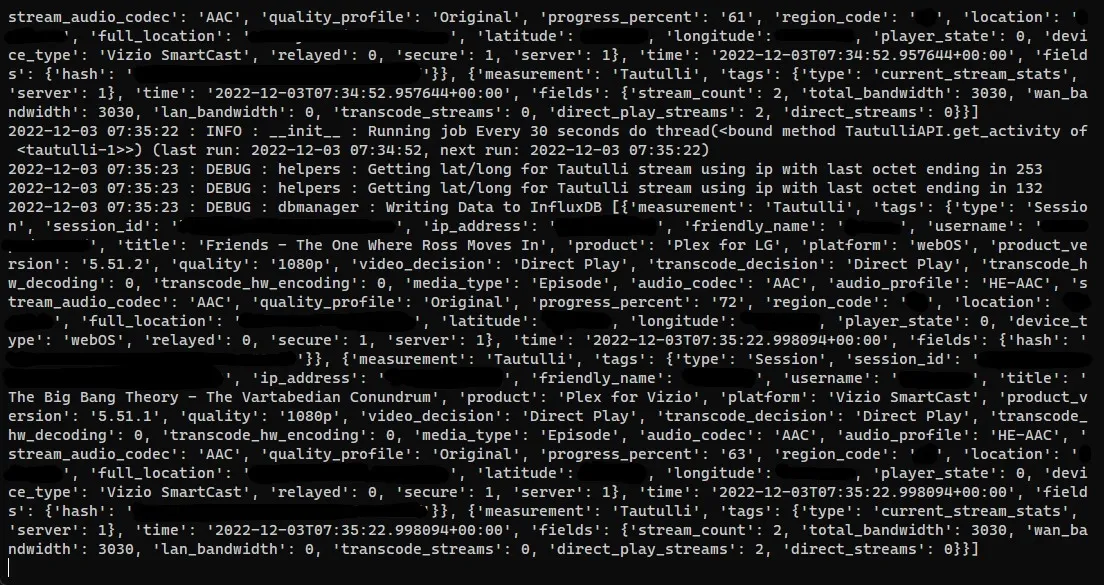 Varken container logs showing data being sent to InfluxDB
With Varken now running and sending data to Influx we can go ahead and set up the dashboard in Grafana.
Setting up the Grafana Dashboard
Login to Grafana and go to Dashboards > Import. Then import the flux dashboard JSON which can be obtained from my blog-files repository here. You can either copy the entire file and paste it into the panel import box or download the JSON file and upload it to Grafana. After finishing the import you should be greeted by the dashboard.
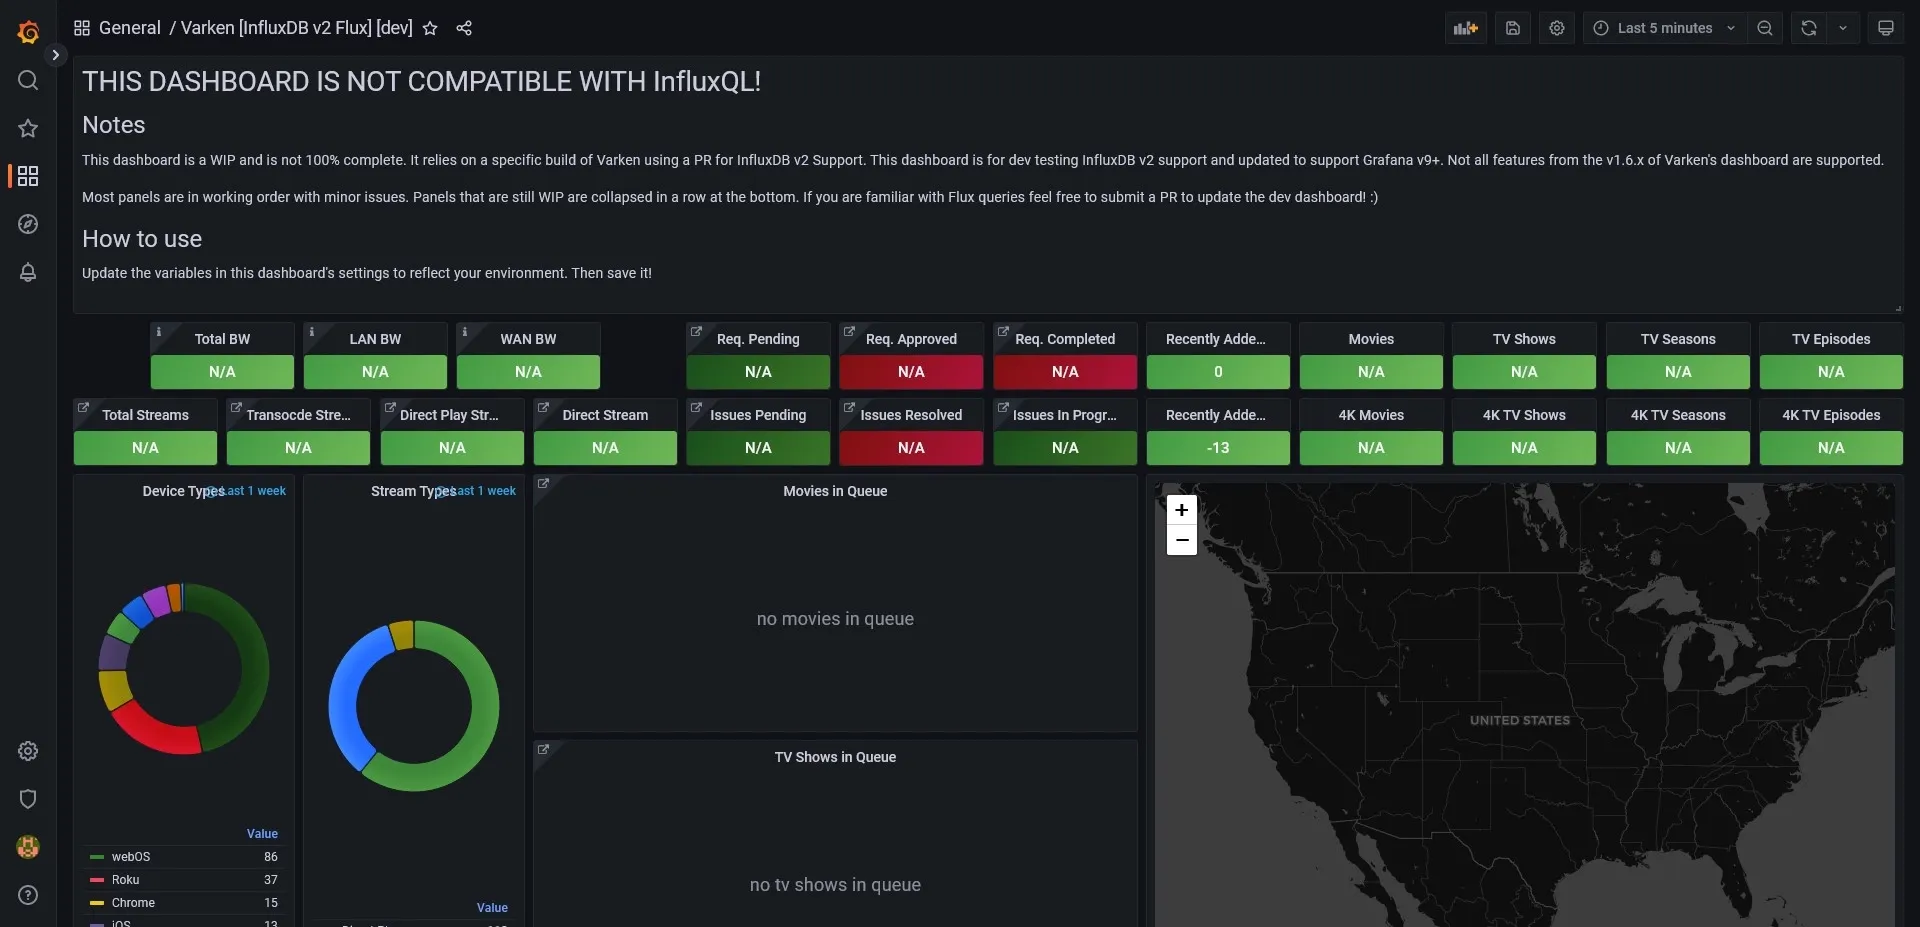 First time dashboard import
A few panels should start updating with data from InfluxDB if you already have an Influx v2 Flux data source set up that Varken is communicating to. You can also go into the dashboard settings and update the variables for Tautulli, Sonarr, Radarr, etc. to give you clickable links from panel data links.
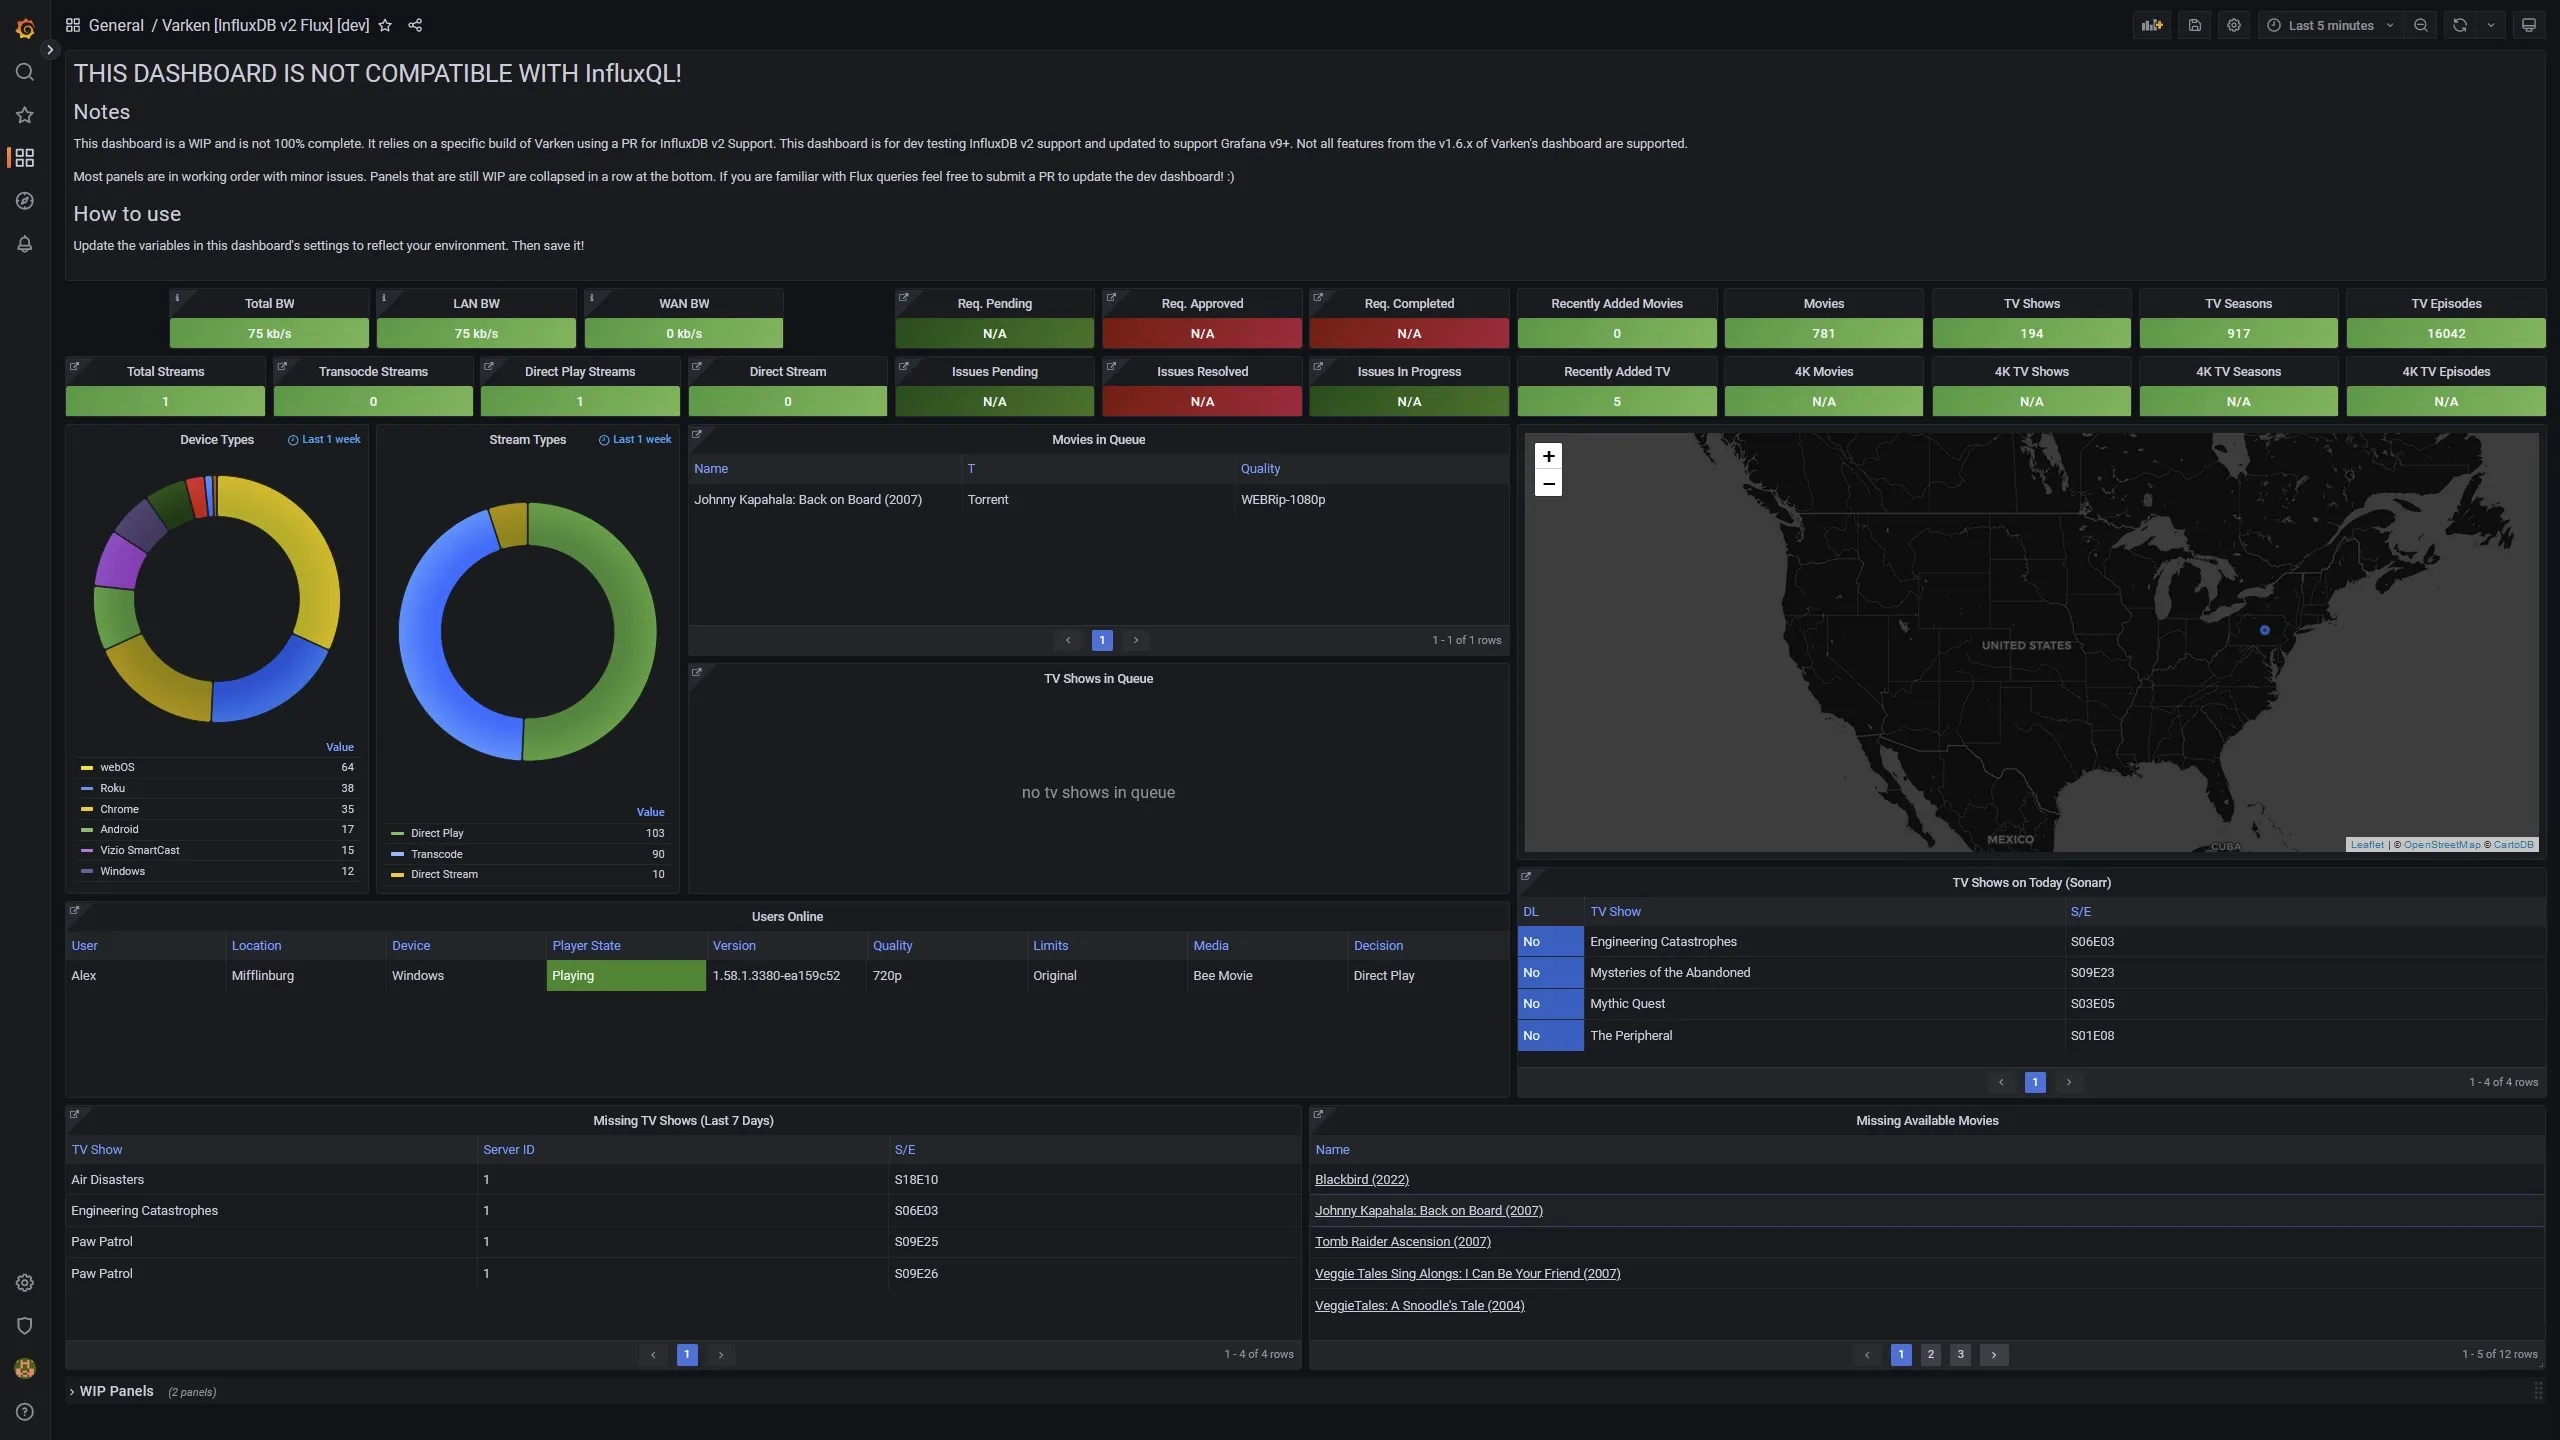 Working Dashboard Example
Conclusion
This dashboard can be easily expanded with more panels and data from other supported Varken services as well as stats from something like Telegraf. Note that this dashboard is a WIP and I’ll be adding more panels for Varken’s other services over time. If you like Varken consider support the developers: ko-fi. As always if you run into any issues let me know via the issues’ section of the blog-files repository or drop a comment down below!