· Alexander · Grafana · 10 min read
Grafana - Getting Started
Getting started with Grafana

So you’ve seen a cool Dashboard on /r/homelab with graphs and status panels, and now you want one for your lab. Well let me tell you a little secret. It’s actually really easy to set up! This guide series will walk you through how to set up Grafana, Prometheus, InfluxDB, Telegraf, and a few other data services that pair nicely in a homelab setting. This will be a “get your feet wet” guide series and will get you in the door of the fun world of metrics and monitoring. We will be starting from complete scratch, so to follow along make sure you read through the prerequisites below.
The Environment
This guide series assumes you are on Windows 10 or 11 with Windows Terminal, Visual Studio Code, the OpenSSH Client installed and to keep this guide easy to update in the future, that you already have a Ubuntu Server or similar Linux imaged system already running and ready. If you do not know how to install Ubuntu Server, check out this guide from Ubuntu.
Pre-Requisites
- Have an x86 computing device (PC, Server, Workstation, Micro PC, etc.) with Ubuntu Server installed.
- You can use a Raspberry Pi or other ARM based device. Just make sure to change docker / compose commands to use built for ARM images instead.
- Have an IDE / Text Editor installed on your pc.
- I recommend Visual Studio Code with the Remote SSH extension installed.
- Access to a good internet connection.
- Have a spare monitor and keyboard handy.
- Your favorite drink and snacks within reach. ( A must for hobbies )
Grafana
If you are not familiar with Grafana, let me give you a quick run down on what it is and is not. Grafana is a data visualization tool that allows you to observe your data using charts, graphs, etc. It is not a replacement for things like Homer / Dashy or other similar dashboard software. Basically if you are wanting to monitor service metrics / logs then Grafana is for you.
Connecting to the Machine
First thing we need to do is hook up Visual Studio Code (VSC) to the machine we will be running Grafana, etc. on. For this we will be using the Remote - SSH extension for VSC. ( If you don’t have the extension installed yet, go ahead and install it. )
- Open File Explorer and navigate to
C:\Users\<username>\.ssh - Right click and select “New > Text Document”
- Name the new file
vsc_configand remove the.txtextension.
- Open Visual Studio Code and click on Extensions in the navigation column on the left.
- Under “Installed Extensions” find “Remote - SSH” and click on the settings gear then extension setting.
- In the field labeled “Remote.SSH: Config File” add the location of your SSH config file.
- If you created the file above it will be
C:\Users\<username>\.ssh\vsc_config - If you are using your default ssh config file then the path will be
C:\Users\<username>\.ssh\config
- Close the settings Window
- Click on the green icon in the lower left
- In the dropdown at the top click on “Connect Current Window to Host…”
- Click on ”+ Add New SSH Host…”
- Enter your connection string for the Grafana host machine.
- e.g.
username@192.168.10.1
- Hit Enter
- Select your SSH config file from the drop-down
- Click Connect in the popup notification in the lower right
- In the new VSC window select “Linux” from the dropdown
- If you did not include an identity file in your connection string, enter your password in the prompt.
- Hit Enter to connect to the machine
 Setting up the Remote SSH extension for VSC
Installing Docker
To install Docker we first need to add the apt repository for it to Ubuntu’s apt repository index. Run the following commands to install the prerequisites. You can run these commands in the terminal inside VSC since we are connected to our machine over SSH. If the terminal is not showing you can open by clicking on “Terminal” and then “New Terminal” in the toolbar.
# Update the apt indexsudo apt update
# Install pre-requisites for apt to use HTTPS repositories (These are most likely already installed)sudo apt install \  ca-certificates \  curl \  gnupg \  lsb-release
Now we need to add Docker’s official GPG key:
sudo mkdir -p /etc/apt/keyringscurl -fsSL https://download.docker.com/linux/ubuntu/gpg | sudo gpg --dearmor -o /etc/apt/keyrings/docker.gpgNext add the official repository for Docker:
echo \ "deb [arch=$(dpkg --print-architecture) signed-by=/etc/apt/keyrings/docker.gpg] https://download.docker.com/linux/ubuntu \ $(lsb_release -cs) stable" | sudo tee /etc/apt/sources.list.d/docker.list > /dev/nullOnce the repository is added, we can install the Docker Engine and Docker Compose:
sudo apt updatesudo apt install docker-ce docker-ce-cli containerd.io docker-compose-pluginAfter Docker installs we can add our user to the Docker group, so we don’t have to use sudo before every Docker command.
sudo usermod -aG docker yourusername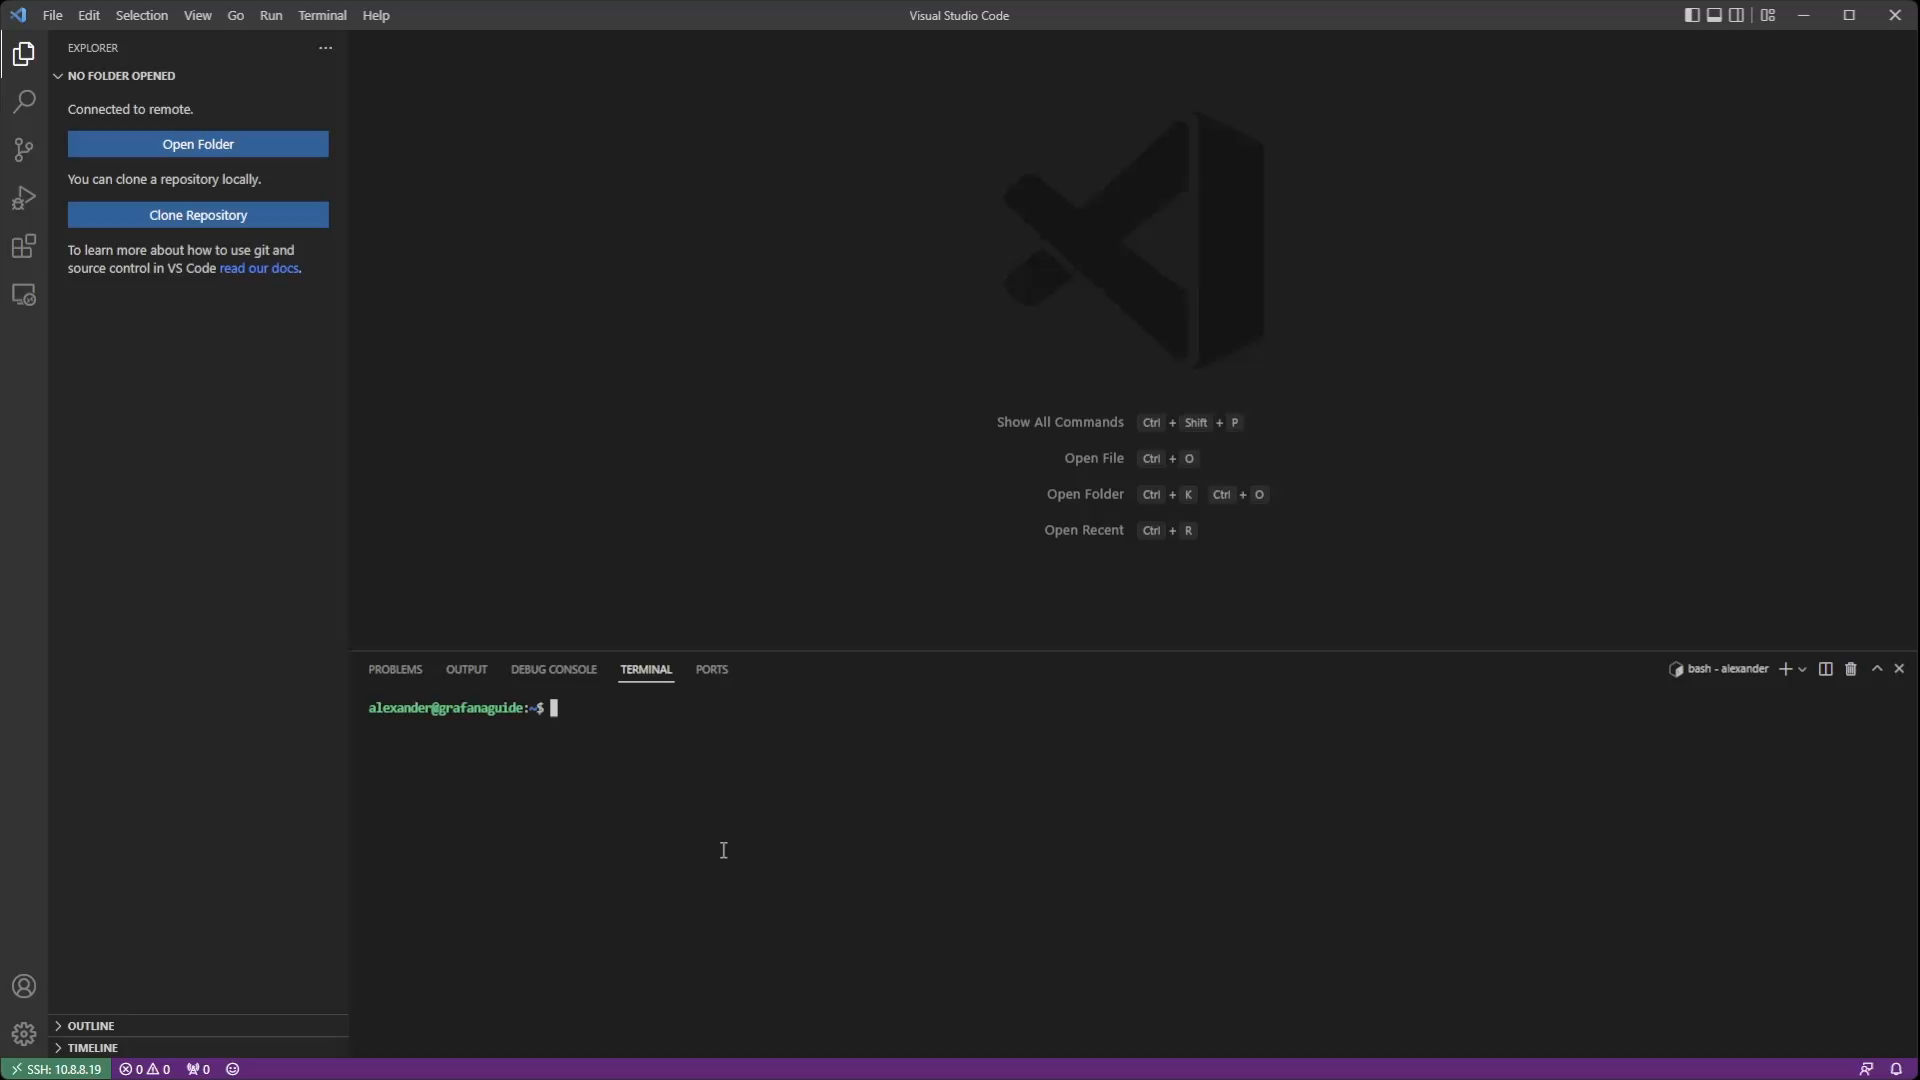
We can check if Docker Engine and Docker Compose were installed properly by running their version commands.
docker versiondocker compose versionYou should see an output similar to the image below.
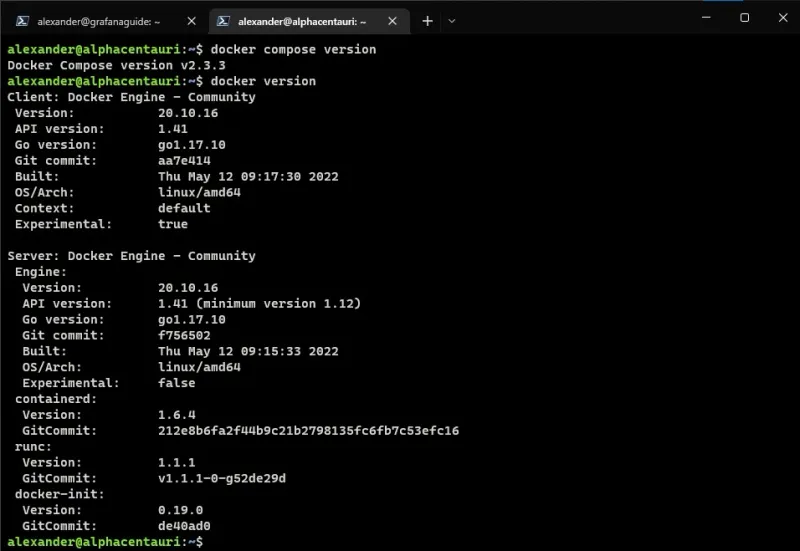 Output examples of
 docker version and docker compose versionWhile we are working on Docker, let’s update the logging driver to keep our log files from getting huge. Doing this now means we do not have to define it ourselves in the compose files later. To do this we need to edit the daemon.json file located in /etc/docker/. You will need to run this command from a terminal session (can be inside VSC’s terminal).
sudo nano /etc/docker/daemon.jsonThen copy the following JSON configuration into the file.
{ "log-driver": "json-file", "log-level": "", "log-opts": { "cache-disabled": "false", "cache-max-file": "5", "cache-max-size": "20m", "cache-compress": "true", "max-file": "2", "max-size": "10m" }}Save and close the file by hitting CTRL + X then y.
Setting up Prometheus
Now that we have Docker installed and configured we can start setting up our services. First up is Prometheus! We will be using Prometheus to gather metrics from our host machine via Node Exporter. First let’s create a directory structure for Prometheus.
sudo mkdir -p /opt/docker/prometheuscd /opt/docker/prometheusNext create the docker-compose.yml file and edit it.
touch docker-compose.ymlcode docker-compose.ymlCopy the following into the docker-compose.yml file:
version: '3'services: prometheus: restart: unless-stopped image: prom/prometheus:latest volumes: - ./prometheus.yml:/etc/prometheus/prometheus.yml - prometheus_data:/prometheus command: - '--config.file=/etc/prometheus/prometheus.yml' - '--storage.tsdb.path=/prometheus' - '--web.console.libraries=/usr/share/prometheus/console_libraries' - '--web.console.templates=/usr/share/prometheus/consoles' ports: - 9090:9090
volumes: prometheus_data: {}Save the file using CTRL+S. You can close it by clicking the X next to the name in the tab bar.
Deploying Node Exporter
Since we are deploying Node Exporter as another Docker container, we need to create the compose file for it. So let’s make a new directory in /opt/docker/prometheus to house it.
mkdir exporterscd exportersNext create the docker-compose.yml file and edit it.
touch node-exporter.ymlcode node-exporter.ymlCopy the following into the node-exporter.yml file:
version: '3'services: node_exporter: restart: unless-stopped image: quay.io/prometheus/node-exporter:latest command: - '--path.rootfs=/host' network_mode: host pid: host volumes: - '/:/host:ro,rslave'Save the file using CTRL+S. You can close it by clicking the X next to the name in the tab bar. Now deploy Node Exporter:
docker compose -f node-exporter.yml up -dTo verify that it’s working you can run:
curl localhost:9100/metricsYou should see an output like the following:
Configuring Prometheus to Scrape Node Exporter
Now that we have Node Exporter running we can update Prometheus to scrape it for data. Edit the prometheus.yml file with the following:
cd ..code prometheus.ymlCopy the following into the Prometheus config file:
# Set global scrape interval (how long between prometheus data scrapes on exporters)global: scrape_interval: 15s
# Define the scrape job(s)scrape_configs:- job_name: node static_configs: - targets: ['<your-machine-ip>:9100']Replace <your-machine-ip> with the IP of your Docker host. Then save the file using CTRL+S. You can close it by clicking the X next to the name in the tab bar.
Deploying Prometheus
To deploy Prometheus, run the following command inside the /opt/docker/prometheus directory.
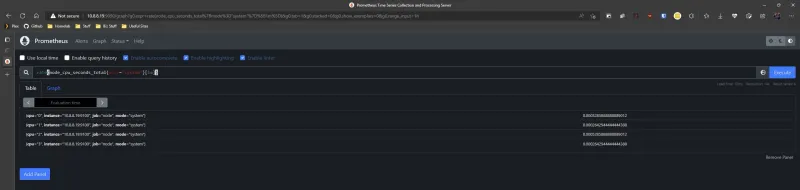
docker compose up -dOnce deployed, open a browser tab and navigate to http://your-docker-machine-ip:9090/graph. When Prometheus’s query UI loads run the following in the Expression box.
rate(node_cpu_seconds_total{mode="system"}[1m])You should see an output similar to the one pictured below.
Configuring Grafana to Use Prometheus
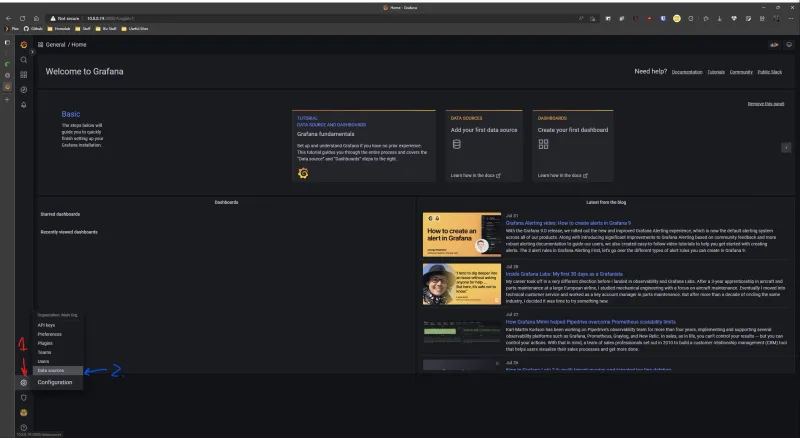
With Prometheus running and scraping metrics from our Node Exporter, we can now configure Grafana to read that data and display it in a dashboard. So first login to Grafana, then follow the steps below to set up the Prometheus data source and configure the dashboard.
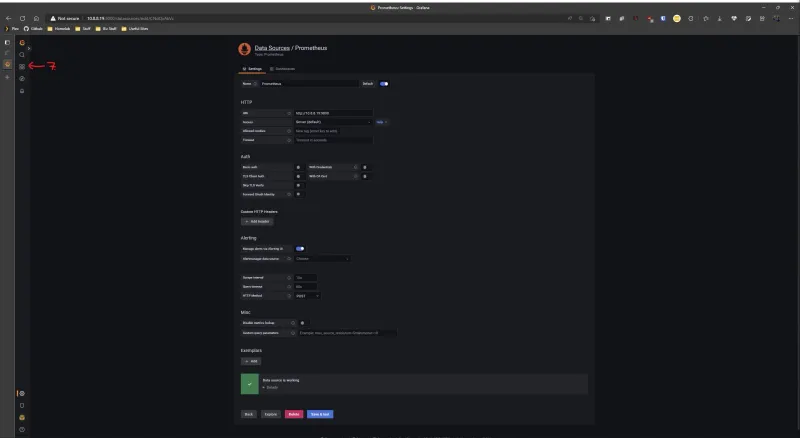
- Click on the Settings cog
- Click “Data sources”
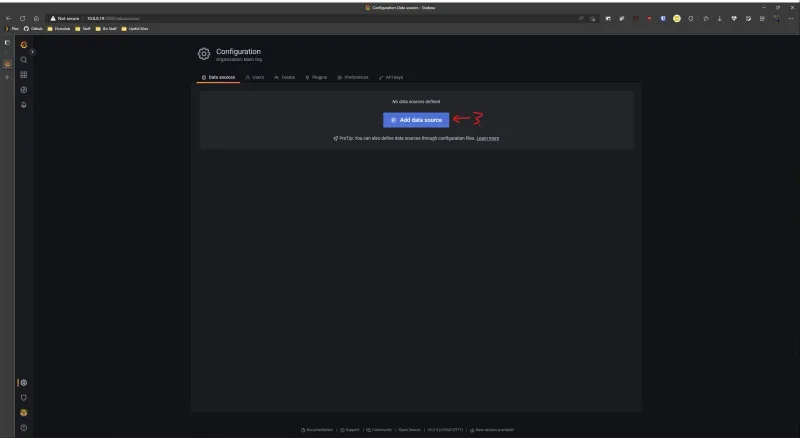
- Click the “Add data source” button
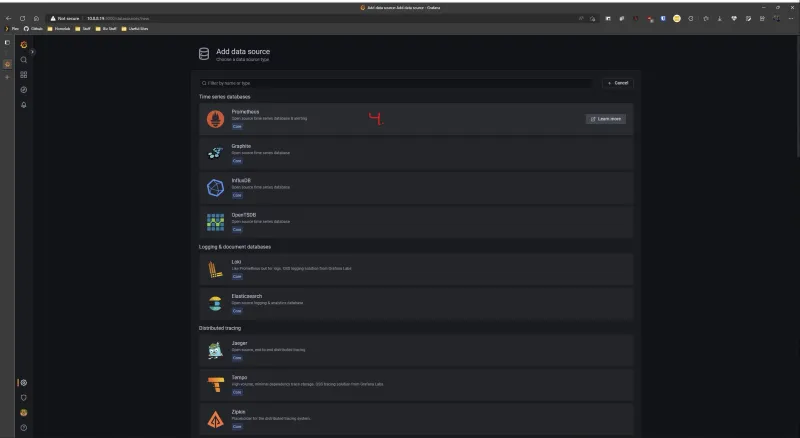
- Click on “Prometheus” from the list of options
- Fill out the following info: a. Name your data source (default is Prometheus) b. Enter
http://your-machine-ip:9090for the URL c. Click Save & test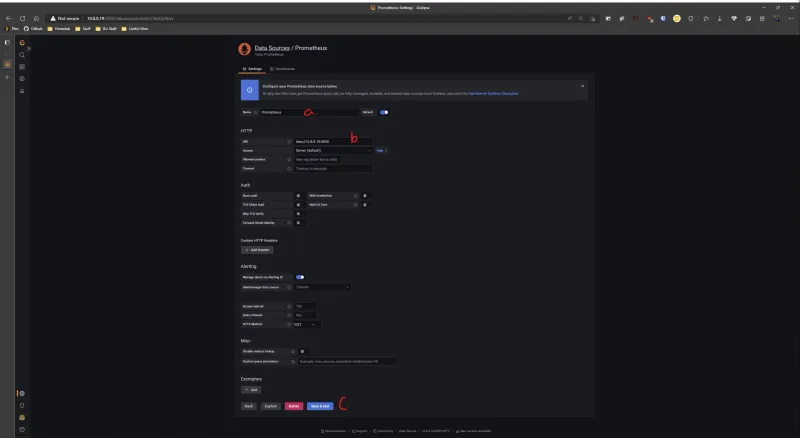
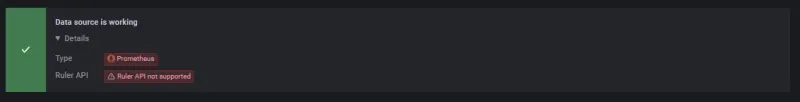
- After you click “Save & test” you should see a green check mark notification tell you the data source is working.
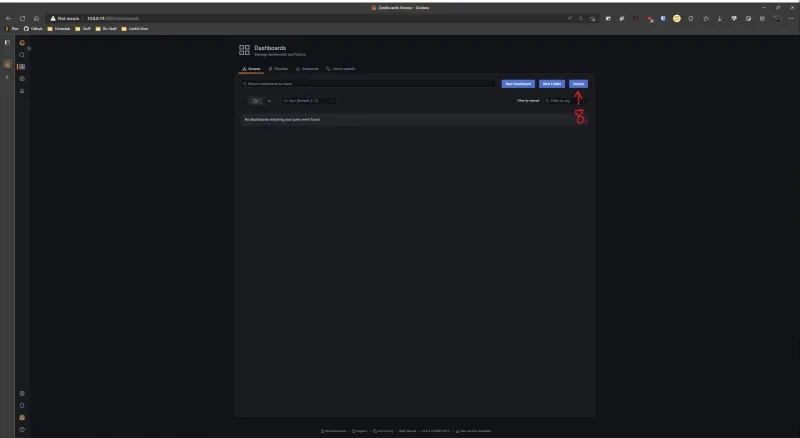
- Click the Dashboard button in the left-hand menu
- Click on “Import”
- Importing the Dashboard a. Enter
1860into the “Import via grafana.com” box b. Click Load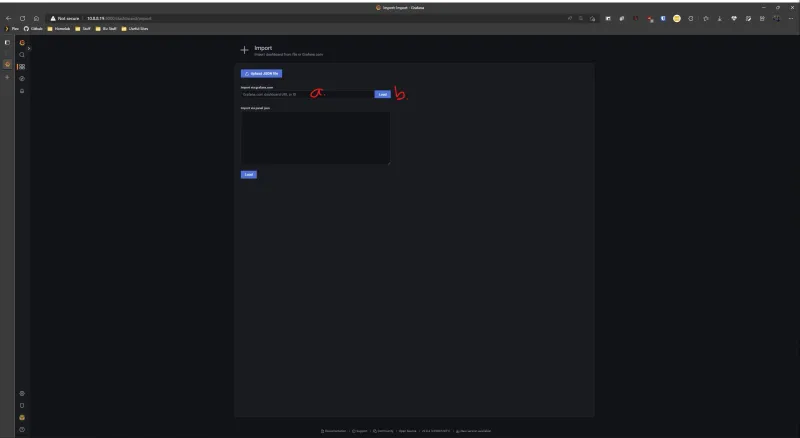 c. Edit the name of your Dashboard (what will be displayed) d. Select “Prometheus (default)” from the dropdown e. Click Import
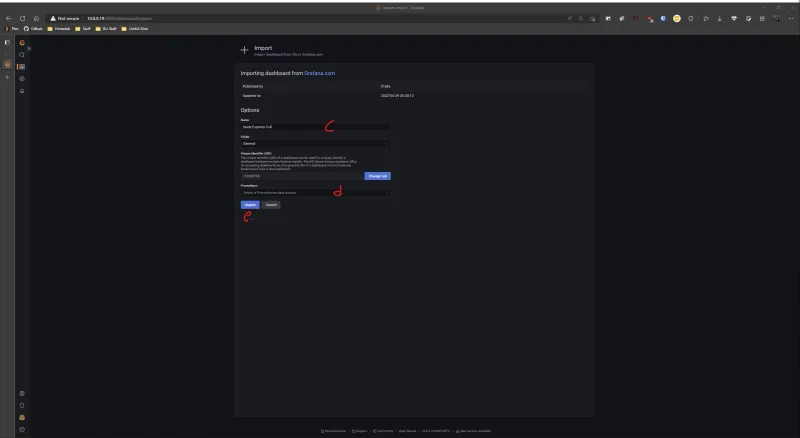
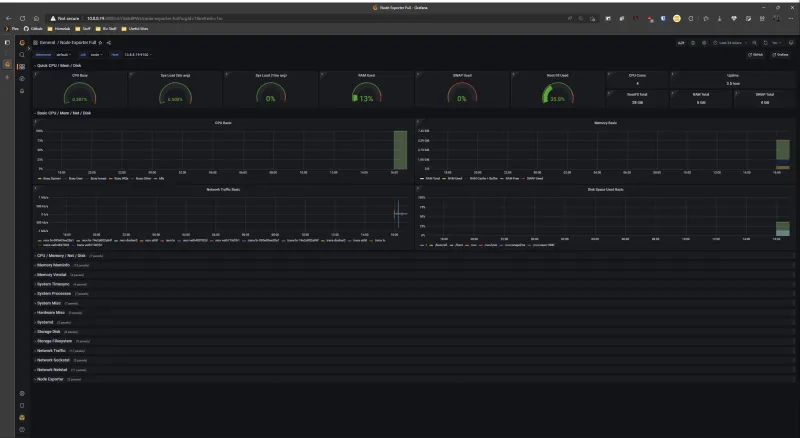
After you click Import, you will be taken to your new dashboard! You can now explore the dashboard, as well as the queries each panel is making to Prometheus.
Conclusion
In an effort to keep this guide series easy to follow, I have broken it up into a series of posts. This is just part 1! The next part we will be covering InfluxDB and Telegraf. As always if you run into any issues let me know down below or reach out via email!
Thanks to my good friend Stefan for helping proof this post!
![Monitoring Your Plex Media Server with Varken [Dev]](/_astro/grafana_varken_banner.DL5u6q_r.webp)